New-vehicle average transaction prices (ATP) in March 2024 declined from February and were lower year over year by 2.7%.
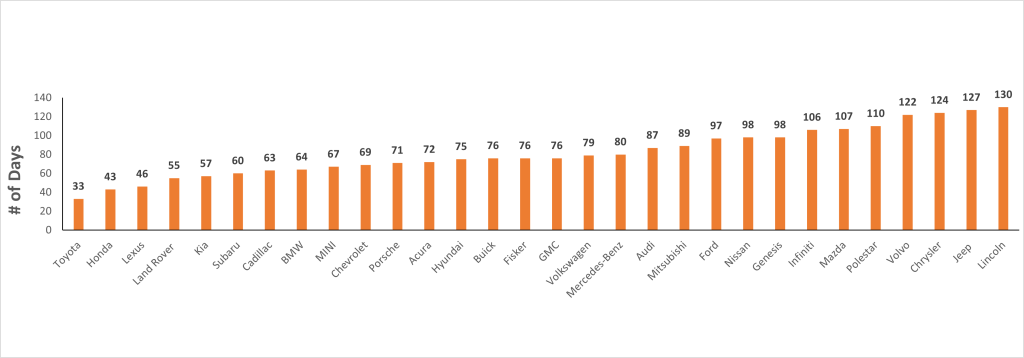
Days’ supply drops to 72 days as sales increase through the month of March.
Among the top 20 markets, colder weather cities continue to hold the highest days’ supply.
3-Month Sales Trend*
Month
Avg. Daily Retail Sales
January
43,200
February
50,000
March
53,700
Average Transaction Price*
Month
Amount
January
$47,401
February
$47,285
March
$47,218
Days’ Supply*
Month
# of Days
January
80
February
76
March
72
Daily Holding Cost Per New Car*
Month
Amount
January
$7.69
February
$7.60
March
$7.71
Dealer Profit Per New Car**
Month
Amount
January
$2,817
February
$2,574
March
$2,487
OEM Days’ Supply*
Rebates & Incentives
Latest News
Average Blended Incentive is $3,121.
All segments saw slight increases over February continuing to show signs of an active car market.
Inventory levels remain abundant providing options to consumers while also offering attractive incentives.
Full-Size Pick-up Segment
Sales remain mostly consistent over a 6-month average while active supply continued to increase slightly for March.
Mid-Size SUV Segment
Most brands have increased their active supply over the past 3-6 months giving customers ample supply on the showroom floor.
Mid-Size Sedan Segment
Incentive increases appear to be increasing sales across the segment.
“Since April 2023, the new-vehicle SAAR has experienced some large swings, with an average sales pace in the mid-15 million level. This month, more volatility in the market is also expected, although the sales pace is anticipated to rise slightly. Despite high interest rates and elevated vehicle prices, consumers remain resilient. Sales growth may be sluggish, but growth continues. And we expect these conditions to persist throughout the year.”
– Charlie Chesbrough, Cox Automotive Senior Economist